Honesty and Ethics: Verify then Trust
(Trust laws of physics and biology: verify the rest)
Everything offered on this Web-site was obtained from or mathematically computed from publicly available sources of data on the Internet or public libraries and documents reachable from the US.
“People who are very aware that they have more knowledge than the average person are often very unaware that they do not have one-tenth of the knowledge of all of the average persons put together. In this situation, for the intelligentsia to impose their notions on ordinary people is essentially to impose ignorance on knowledge.” - Thomas Sowel
“People who are very aware that they have more knowledge than the average person are often very unaware that they do not have one-tenth of the knowledge of all of the average persons put together. In this situation, for the intelligentsia to impose their notions on ordinary people is essentially to impose ignorance on knowledge.” - Thomas Sowel
Illustration: Did continued BAER testing reduce deafness percentages in some AKC Breeds?[1], March 2011
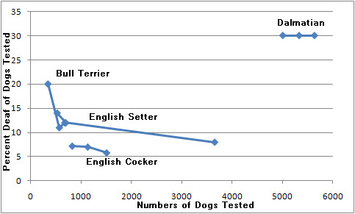
“Verifying” published scientific data can be difficult for persons lacking a “black-belt” in scientific jargon and a “sheep-dip” in practical statistics. Many friends of deaf dogs questioned the validity of unusual data trends about prevalence (percentages) of deafness among various AKC dog breeds, attributed by the sources to LSU (Louisiana State University). Time span of the reports allegedly exceeded 10 years. The trends were displayed in Figure 1, where the lower, horizontal, axis indicated the cumulative numbers of dogs tested, (presumably using the BAER method.) The corresponding percentage to deafness can be read on the left, vertical axis. Figure 1. Trend of Hearing Prevalence with Population Size
Insight about ratios of uni-ear to bi-ear deaf in some breeds was extracted from the source data.
In summary, nothing discovered in this study indicated that the data was or ought to have been other than as reported at those points in time. Unfortunately the data as presented on the Internet could be easily misunderstood or misrepresented.
NOTE: February, 2012; An alleged owner of a litter of purbred puppies decribed on an Internet list that the person had taken a BAER-deaf puppy back for a re-test, and was delighted on the second test to receive a certificate of bi-ear hearing for the puppy. This seemed to confirm that indeed by repeating BAER-testing a specific puppy, perhaps at different facilities, indeed reported Breed deafness rates can be reduced. When by repeating BAER tests, an owner can buy a bi-ear hearing certificate that can convert a useless puppy to a potential Champion worth many US $thousands, after about 30 years of BAER testing human greed, corruption and subterfuge could destroy the reliability-integrity of BAER tests for serving as proofs.
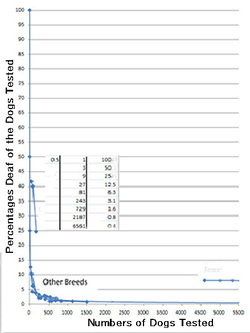
Figure 2. Multiple Breeds
Discussion: A person familiar with ordinary quality control statistical sampling might be puzzled by the downward trend of the percentages of deafness in three of the four breeds, as testing was done on more dogs. Quality sampling of products usually has an up and down “wriggling” trend of the average percentage about (above and below) the average for the long-term as more items are tested. That seemed true for the long term trend of Dalmatians, with an elevated nearly a flat trend after 5,000 dogs were tested; Figure 2 è
The peculiarly consistent downward trend for the other breeds might have various causes:
1)Deaf dogs of each breed were being killed rapidly at first and then more slowly later as testing continued.
2) Perhaps owners of the tested breeds energetically hid their deaf dogs from the testing organizations (entirely plausible because the known policy of a main testing group was that all deaf dogs should be killed if they failed a BAER dog deafness test) [i].
3) Changes in selective breeding criteria as urged by the Dalmatian Club of America (DCA) and others, so that the births of deaf dogs were rapidly decreasing
4) Biased selection of the dogs to be tested, possibly for example, by at first testing only know or probably deaf dogs for each breed. Because other than among Dalmatians, genetically deaf dogs were comparatively rare, [ii] it was plausible that to test very large numbers of each breed’s dogs, more and more hearing dogs were tested in each new group[iii].
{Not to be forgotten, any biases that remain unknown might have arisen from the earliest of the BAER tests being done (as alleged) with comatose anesthetized dogs, some of whom may well have died during the tests. By 2010 because of complaints, the US “official’ protocols usually called for un-sedated dogs during any BAER tests that might lead to the cremation (killing) of a dog if deaf. Further, the US BAER tests to determine deafness of dogs prescribed testing only over air-carried sound frequencies used by ordinary people; [ i.e. an anthropomorphic assumption that deaf dogs are human to great degree (for purposes of the tests costs being more affordable? ]}
A scientist with a sense of curiosity might mathematically examine the plausibility that the reported trends arose because of a biased-sampling method, by fitting a “test” equation for each breed, and for the “cloud” of data of the breeds [iv], excepting the Dalmatian breed who were for several reasons unique. In the laws of Physics, the general shape of an equation’s curve representing a physical process was often known: as for example, the flight of a cannon ball was expected to follow nearly along a parabola curve of height and distance.
The “BAER dog-test” curve’s criteria included:
1) It had to go through either 100 percent or zero percent for the dog tested first, which would be either a deaf or a hearing dog.
2) After the testing of perhaps 6,000 dogs, the average percentage of deafness of each breed was expected to become nearly constant, similar to the Dalmatian breeds. {If the long term values failed to settle to nearly constant by the completion of 6,000 tests, an investigation might be wanted to discover who was killing the dogs, hiding them, or changing the genetic selection criteria for breeding.}
3) Because the purpose of the reported testing of dogs was believed to include proving that genetic deafness was present in a selected (every?) AKC breed, the simplest assumption was that a deaf dog was tested first of each breed, i.e. thus 100 percent deafness for that breed at that instant, based on the sample of one dog. Further testing primarily biased toward testing of deaf dogs would deplete (reduce) the supply of deaf dogs of that breed, so as more and more dogs were tested that would force downward the reported percentage of deaf dogs among the population tested (which agreed with the trend of data in Dr Strain’s reports over a span of many years.)
Results of the mathematical curve-fit ‘test’ criteria were shown in Figure 2, where values of the curve were presented in the inserted table, where the assumed numbers of dogs tested were in the 2nd column and the deafness percentages in the 3d (rightmost). As seen, the data of the AKC breeds tests reported by LSU were close to a single line, excepting the Dalmatians and the Catahoulas. The projected estimate of typical deafness for the tested AKC breeds in populations over 5,000 was about 0.4 percent, plus or minus about one sigma of 0.13 percent. Results were consistent with the data and laws of physics for a biased selection. Biased selection is a legitimate scientific procedure, but is customarily mentioned in the reports of data. QED
Other insights were extracted from the data sources, such as representative ratios of uni-ear and bi-ear deafness of some breeds. Information was judged to be adequately consistent for data reported about 10 years apart, 1999 and 2010.
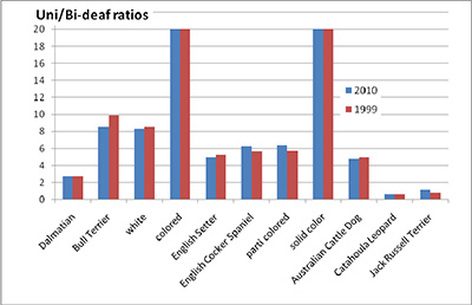
Figure 3 - Ratios of Uni/Bi-ear Deafness of Dogs per Breed
The Catahoula data certainly and Jack Russell data possibly because of a smaller sample size of their breeds were perhaps less trustworthy than for other breeds, Bull terriers and English Spaniel breeds data were subdivided because of conclusive information that the coat colors correlated to deafness rates. The data table is provided to a precision of one significant digit. The ratios can be roughly back-converted, as for example for Dalmatians the quantities of one-ear deaf were about three
(3) Uni-deafs multiples greater than the two-ears deaf. For US Dalmatians, specifically 20 percent were typically uni-ear deaf and 8 percent (at least) were bi-ear deaf.
Further, the ‘dramatic’ ratio of 20:1 for the ‘natural’ coat colors of the Bull terriers and English Cocker Spaniels, as compared to the “fancy” of “flashy” coats, correlated with well known modern (2010) “Web-list reports” among breeders of Dachshunds, Border Collies, Great Danes and other breeds that selective breeding for fancy-flashy coats to meet market desires (maximum profits for breeders) was resulting in increased numbers of deaf and blind puppies and an increase in epilepsy and other genetic-based diseases.
Literature search of Web reports by deaf-dogs rescue organizations in the US seem to confirm a rapid increase recently of the quantity of deliberately breed “boutique” flashy coat deaf and blind dogs. My personal survey at the 2010 US National sheep dog trials supported the suspicion of that influence also on the US Border Collies, etc, where there were reports of new unexpected instances of deaf sheep herder breed dogs.
Table 1 Uni/Bi-ear Deafness Ratios
ANALAYSIS-Breed 2010 1999
Dalmatian 3 3
Bull Terrier 9 10
- white 8 9
- colored 20 20
English Setter 5 5
English Cocker Spaniel 6 6
- parti colored 6 6
- solid color 20 20
Australian Cattle Dog 5 5
Catahoula Leopard 1 1
Jack Russell Terrier 1 1
Comment: Data ought not be discarded merely because the experiments and their statistics were unusual, as were the LSU reported data. Significant insights sometimes can be extracted anyway, by a wee bit of “analytical distillation”; analogous to extracting brandy from wine by means of distillation.
References - -
[i] Stanley Coren, “How Dogs Think”; 2004; Free Press
[ii] http://www.lsu.edu/deafness/genetics.htm; {…… reported to be 2.56 to 6.5 cases per 10,000 dogs seen at veterinary school teaching hospitals,…}
[iii] www.lsu.edu/deafness/incidenc.htm
[iv] www.gsdhelp.info/ear/deaf.html
[v]Illustration: Imagine a large barrel containing mostly red apples, and less than one (1) per 100 yellow apples. A lad is sent into the cellar daily to get as many yellow apples as he can and fill out the batch for the day with reds, but has only five minutes for the task. He at first easily finds his quota. Soon however, the yellow apples near the top of the barrel are gone, and the lad has to include more and more red apples to get his total off apples in five (5) minutes. - - That could create what statisticians might call a “selection-biased” sampling, exaggerating the percentages of yellow apples (deaf dogs) severely at first but coming closer to the true average of reds and yellow over several months.
[vi] Dr Strain: LSU; 2010, Strain; Presentation to Australian Cattle Dog Club, 2004
[vii.] http://www.ohmidog.com/2009/08/11/american-dog-population-rises-to-77-5-million;(The 2009-2010 National Pet Owners Survey includes more than 500 pages of information on pets covering the past two decades and retails for $1,695);
[viii] “The State of the Animals 2001”, Humane Society Press, edt D.J. Salem, A.N. Rowan [Maybe available thru a local Library];
[ix]American Veterinary Medical Assc, "U.S. PET Ownership and Demographics Sourcebook", Center for Information Management, 1997;
[x] Strain, G.M., B.L. Tedford, and R.M. Jackson. 1991; Postnatal development of the brainstem auditory-evoked potential in dogs. Am. J. Vet. Res. 52:410-415.